Last Updated on February 13, 2026 by admin
Running a business without tracking financial metrics is like navigating without a compass—you might keep moving, but you won’t know if you’re on the right course. These metrics serve as a guide, offering insight into performance, profitability, and long-term sustainability. They empower leaders to make smarter decisions and anticipate challenges before they arise.
Business success isn’t just about driving sales—it’s about understanding the financial health behind them. By keeping a close eye on the right financial indicators, business owners can spot risks early, strengthen stability, and unlock growth opportunities. Below are the key financial metrics every business should monitor.
What Are Metrics?
Metrics are measurements used to evaluate, track, and understand performance, progress, or outcomes in a specific area. They provide numerical data or indicators that help organizations, teams, or individuals assess whether they are meeting goals, improving processes, or achieving success. In essence, metrics turn abstract concepts like “growth” or “efficiency” into quantifiable values that can be analyzed and compared.
What are financial Metrics?
Financial metrics are quantifiable measures used to evaluate the financial performance, stability, and efficiency of a business. They act as key performance indicators (KPIs) that help managers, investors, and stakeholders understand how well a company is managing its resources, generating profits, and sustaining growth.
Financial KPIs (Key Performance Indicators) are specific, measurable metrics that businesses use to evaluate their financial performance and progress toward strategic goals. They go beyond raw financial data by highlighting the most critical aspects of profitability, efficiency, liquidity, and growth, helping leaders make informed decisions.
Key metrics and KPIs must be shared internally on a consistent basis—ideally through weekly or monthly email updates, dashboards, or formal reports. Regular distribution ensures that decision-makers stay informed and can act quickly. If such updates aren’t readily available, managers can still gain valuable insights by analyzing financial statements directly to familiarize themselves with the underlying metrics.
Read: Annual Percentage Rate (APR): Type, Meaning, and How It’s Calculated
How to Track Financial Metrics Effectively
Core metric
Monitoring financial metrics is essential for understanding the health of a business, making informed decisions, and driving sustainable growth. Here’s a structured guide on how to track financial metrics in a practical and impactful way.
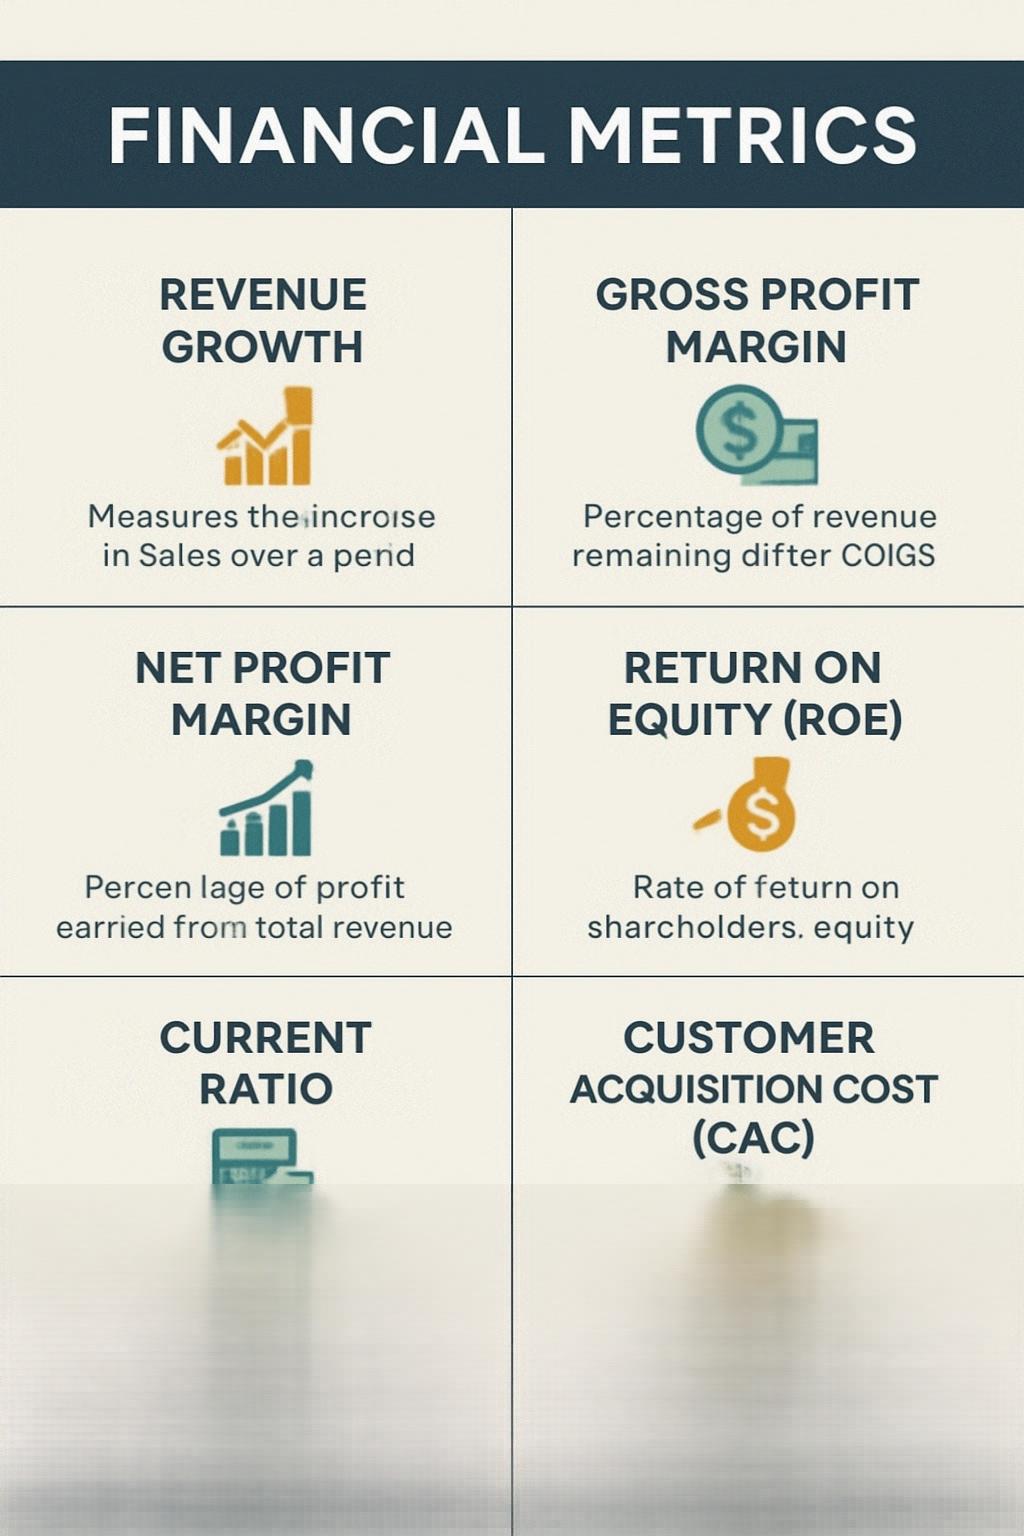
Revenue Growth
Measures the change in sales over time, highlighting whether your business is expanding or contracting. It serves as a key indicator of customer demand, product-market fit, and overall momentum. For instance, a 15% year-over-year increase in revenue demonstrates strong market traction and healthy growth.
Rising revenue signals that customers are purchasing more, reflecting strong demand for your product or service. When costs are managed effectively, sustained growth often leads to higher profitability. Analysts frequently compare revenue growth with net income growth to determine whether sales expansion is translating into real financial gains.
Revenue also drives efficiency metrics such as asset turnover and inventory turnover, with higher sales improving resource utilization. Stronger revenue streams enhance cash flow, which supports healthier liquidity ratios like the current and quick ratios.
Ultimately, consistent revenue growth reassures investors and lenders that the business is financially sound and moving forward with momentum.
To calculate Revenue Growth, you use a simple formula that compares sales from one period to another:
- Revenue last year: $1,000,000
- Revenue this year: $1,150,000
It reveals the percentage of revenue left after covering the cost of goods sold (COGS). A higher margin means more funds are available for operating expenses, debt repayment, or reinvestment. It also highlights how effectively a company manages production costs relative to sales.
Strong margins signal efficient resource use and effective pricing strategies. Expanding margins often point to improved cost control or pricing power, while shrinking margins may indicate rising input costs or competitive pressures.
Healthy margins strengthen cash flow, which supports liquidity ratios and overall financial stability. Consistency in margins reassures stakeholders that the company can sustain profitability even when revenues fluctuate.
It shows a profitability metric that measures how efficiently a company produces and sells its goods relative to its revenue. It measures the percentage of revenue that exceeds the cost of goods sold (COGS), highlighting how much money remains to cover operating expenses, interest, taxes, and profit.
Formula
Where:
- Gross Profit = Revenue – Cost of Goods Sold (COGS)
- Revenue = Total sales income
Example Calculation
Suppose a company has:
- Revenue = $500,000
- COGS = $300,000
Step 1: Calculate Gross Profit
Step 2: Apply Formula
So, the company retains 40 cents of gross profit for every dollar of sales.
3, Operating Cash Flow
Operating Cash Flow (OCF) is one of the most critical measures of a company’s financial health. It reflects the actual cash generated from core business operations—excluding financing and investing activities—and serves as a direct indicator of liquidity and the ability to sustain operations over time.
Operating Cash Flow (OCF) captures the actual cash generated and spent through a company’s core business operations—such as revenue from sales, payments to suppliers, and wages for employees. Unlike net income, which can be influenced by non-cash items like depreciation or accruals, OCF zeroes in on tangible, spendable cash that reflects the company’s true liquidity.
Operating Cash Flow (OCF) is calculated using information from a company’s cash flow statement. It represents the cash generated from core business activities, excluding financing and investing.
Formula
There are two main approaches:
1. Indirect Method (most common)
Where:
- Net Income = Profit after taxes
- Non-Cash Expenses = Depreciation, amortization, provisions
- Changes in Working Capital = Adjustments for accounts receivable, inventory, accounts payable, etc.
2. Direct Method
Example Calculation
Suppose a company reports:
- Net Income = $120,000
- Depreciation = $30,000
- Increase in Accounts Receivable = $10,000
- Increase in Accounts Payable = $15,000
Step 1: Add back non-cash expenses
Step 2: Adjust for working capital changes
Operating Cash Flow = $155,000
Read: How to Cancel a Credit Card the Right Way
4, Net Profit Margin: Net Profit Margin is one of the most comprehensive measures of a company’s profitability. Unlike gross or operating margins, it accounts for all expenses—including operating costs, interest, taxes, and non-operating items—providing a clear picture of how much of each dollar of revenue ultimately becomes profit.
Formula
Where:
- Net Profit = Revenue – (COGS + Operating Expenses + Interest + Taxes + Other Expenses)
- Revenue = Total sales income
Example CalculationSuppose a company reports:
- Revenue = $1,000,000
- Net Profit (after all expenses) = $150,000
Step 1: Apply Formula
Result: The company earns 15 cents of net profit for every dollar of sales.
5. Return on Equity (ROE)Return on Equity (ROE) is one of the most widely used financial ratios for assessing a company’s profitability and efficiency. It measures how effectively a company uses shareholders’ equity—the capital invested by owners—to generate net income.
It shows how well management is utilizing shareholder capital to create earnings. A higher ROE generally indicates more efficient use of equity financing. In fact, many analysts view ROE as a benchmark for financial performance, since it directly connects a company’s profitability to the returns delivered on shareholder investment.
Formula
Where:
- Net Income = Profit after taxes and all expenses
- Shareholders’ Equity = Total assets – total liabilities (owners’ residual interest)
Example CalculationSuppose a company reports:
- Net Income = $200,000
- Shareholders’ Equity = $1,000,000
Step 1: Apply Formula
Result: The company generates a 20% return on every dollar of equity invested.
6. Customer Acquisition Cost (CAC) vs. Customer Lifetime Value (CLV)
In the world of business, profitability isn’t just about generating revenue—it’s about balancing the cost of acquiring customers with the value those customers bring over time. Two critical metrics that help companies evaluate this balance are Customer Acquisition Cost (CAC) and Customer Lifetime Value (CLV). Together, they provide a powerful lens into the efficiency of marketing and sales investments.
This metric captures the total cost a company incurs to acquire each new customer, factoring in expenses such as advertising, promotions, and sales team efforts. A lower CAC reflects greater efficiency in marketing and sales, signaling that the business is attracting customers at a more cost-effective rate.
- Formula:
Example CalculationImagine a company spends $100,000 on marketing and sales in a quarter and acquires 500 new customers.
- CAC:
Each customer costs $200 to acquire.
If each customer generates $600 in lifetime value:
- CLV:CAC Ratio:
This ratio indicates efficient investment, aligning with the 3:1 benchmark.
6. Current Ratio
The Current Ratio is a fundamental liquidity metric used to evaluate a company’s ability to meet its short-term obligations. Comparing current assets to current liabilities, it provides insight into whether a business can cover debts and expenses due within a year using resources it already holds.
It compares a company’s current assets (such as cash, receivables, and inventory) to its current liabilities (including accounts payable, short-term debt, and accrued expenses). This metric reflects short-term financial stability and operational resilience. A higher ratio typically signals stronger liquidity and the ability to meet obligations, while a lower ratio may indicate potential cash flow pressures.
Formula
Example Calculation
Suppose a company reports:
- Current Assets = $500,000
- Current Liabilities = $250,000
Step 1: Apply Formula
Result: The company has $2 in current assets for every $1 of current liabilities, suggesting strong short-term financial stability.
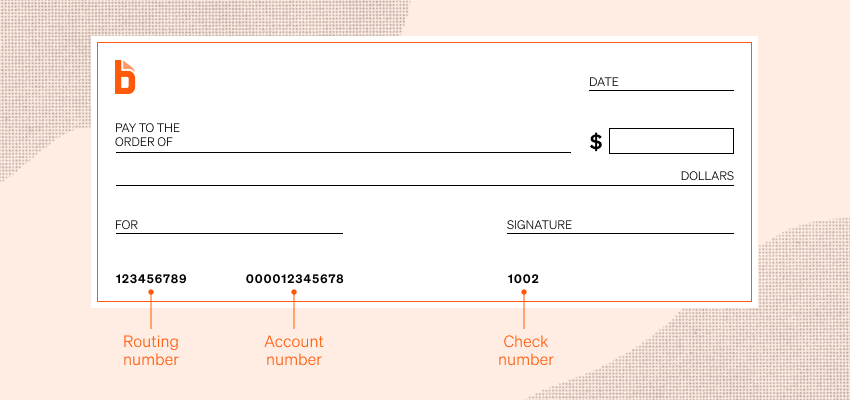
Read: Routing Numbers vs. Account Numbers: What Sets Them Apart
Financial Metrics Across Time Horizons: Daily, Monthly, and Annual Insights
Monitoring financial performance requires different lenses depending on the time frame. Businesses benefit from tracking short-term cash movements as well as long-term profitability and growth. Here’s how financial metrics can be structured across daily, monthly, and annual cycles to provide a comprehensive view of stability and efficiency.
Daily/Weekly Metrics
- Cash Flow: Tracks the inflow and outflow of money, ensuring liquidity for immediate obligations.
- Sales Revenue: Monitors daily or weekly sales performance, helping identify trends and adjust strategies quickly.
- Expenses: Keeps spending in check, allowing managers to spot cost overruns before they escalate.
Purpose: These metrics provide real-time visibility into operational health and help maintain short-term stability.
Monthly Metrics
- Profit Margins: Evaluates profitability after accounting for costs, offering efficiency insight.
- Operating Costs: Reviews recurring expenses such as rent, salaries, and utilities to ensure sustainability.
- Budget Variances: Compares actual performance against planned budgets, highlighting areas of overspending or savings.
Purpose: Monthly reviews allow businesses to adjust strategies, refine budgets, and maintain profitability.
Quarterly/Annual Metrics
- Return on Equity (ROE): Measures how effectively shareholder capital is used to generate profits.
- Debt-to-Equity Ratio: Assesses financial leverage and long-term risk exposure.
- Long-Term Growth Trends: Tracks revenue growth, market expansion, and profitability over extended periods.
Purpose: These metrics provide a strategic view of financial health, guiding investment decisions and long-term planning.
Use Tools and Dashboards
Tracking financial metrics manually can be time-consuming and error-prone. Modern businesses increasingly rely on technology to streamline reporting, improve accuracy, and gain real-time insights. By leveraging the right tools and dashboards, companies can transform raw data into actionable intelligence.
Accounting Software
- Examples: QuickBooks, NetSuite
- Purpose: Automates financial reporting, reconciles accounts, and ensures compliance.
- Benefits: Reduces human error, saves time, and provides standardized reports for decision-making.
Business Intelligence Dashboards
- Examples: ThoughtSpot, Power BI
- Purpose: Offers real-time visualization of financial data, integrating multiple sources into a single view.
- Benefits: Enables quick analysis of trends, supports data-driven decisions, and allows customization for different stakeholders.
Spreadsheets
- Examples: Microsoft Excel, Google Sheets
- Purpose: Provides flexible, low-cost solutions for customized tracking when resources are limited.
- Benefits: Easy to set up, adaptable to specific needs, and useful for small businesses or startups without advanced systems.
Benchmark and Compare
Financial and operational metrics are most powerful when placed in context. Numbers alone don’t tell the full story—what matters is how they stack up against past performance, industry benchmarks, and strategic goals. By benchmarking and comparing, businesses can transform raw data into actionable insights.
1. Historical Performance
- Definition: Comparing current metrics against your own past results.
- Purpose: Reveals trends over time, such as growth, efficiency improvements, or recurring challenges.
- Example: Tracking profit margins year-over-year highlights whether cost control strategies are working.
2. Industry Standards
- Definition: Measuring performance against competitors and market averages.
- Purpose: Provides perspective on whether your company is leading, lagging, or aligned with peers.
- Example: A current ratio of 1.5 may be healthy in retail but below average in manufacturing, where liquidity needs differ.
3. Strategic Goals
- Definition: Comparing metrics against targets set by leadership or long-term plans.
- Purpose: Ensures alignment with organizational priorities and growth objectives.
- Example: If leadership sets a goal of achieving a 20% ROE, benchmarking actual results against this target shows progress toward shareholder value creation.

- How Does Zelle Work? Send And Receive Money - February 16, 2026
- The difference between Checking and Savings Accounts - February 16, 2026
- How to track financial metrics in business - February 13, 2026